

FY2026 Sea Area Monitoring Results
(concentrations of tritium in seawater)
Tritium concentrations obtained sea area monitoring within a 3 km of the power station are well below our operational index (discharge suspension level: 700 Bq/L).
[Click here for details of operational indices]
| Results of quick tritium measurement* | ||
|---|---|---|
| Round | Within a 3 km of the power station | Within a 10 km square in front of the power station |
| 1st | Max. 27 Bq/liter | Below the detection limit |
| 2nd | Max. 13 Bq/liter | Below the detection limit |
*Measurement performed with a detection limit of approx. 10 Bq/liter in order to obtain the results quickly.
Comparison of concentration of tritium in seawater
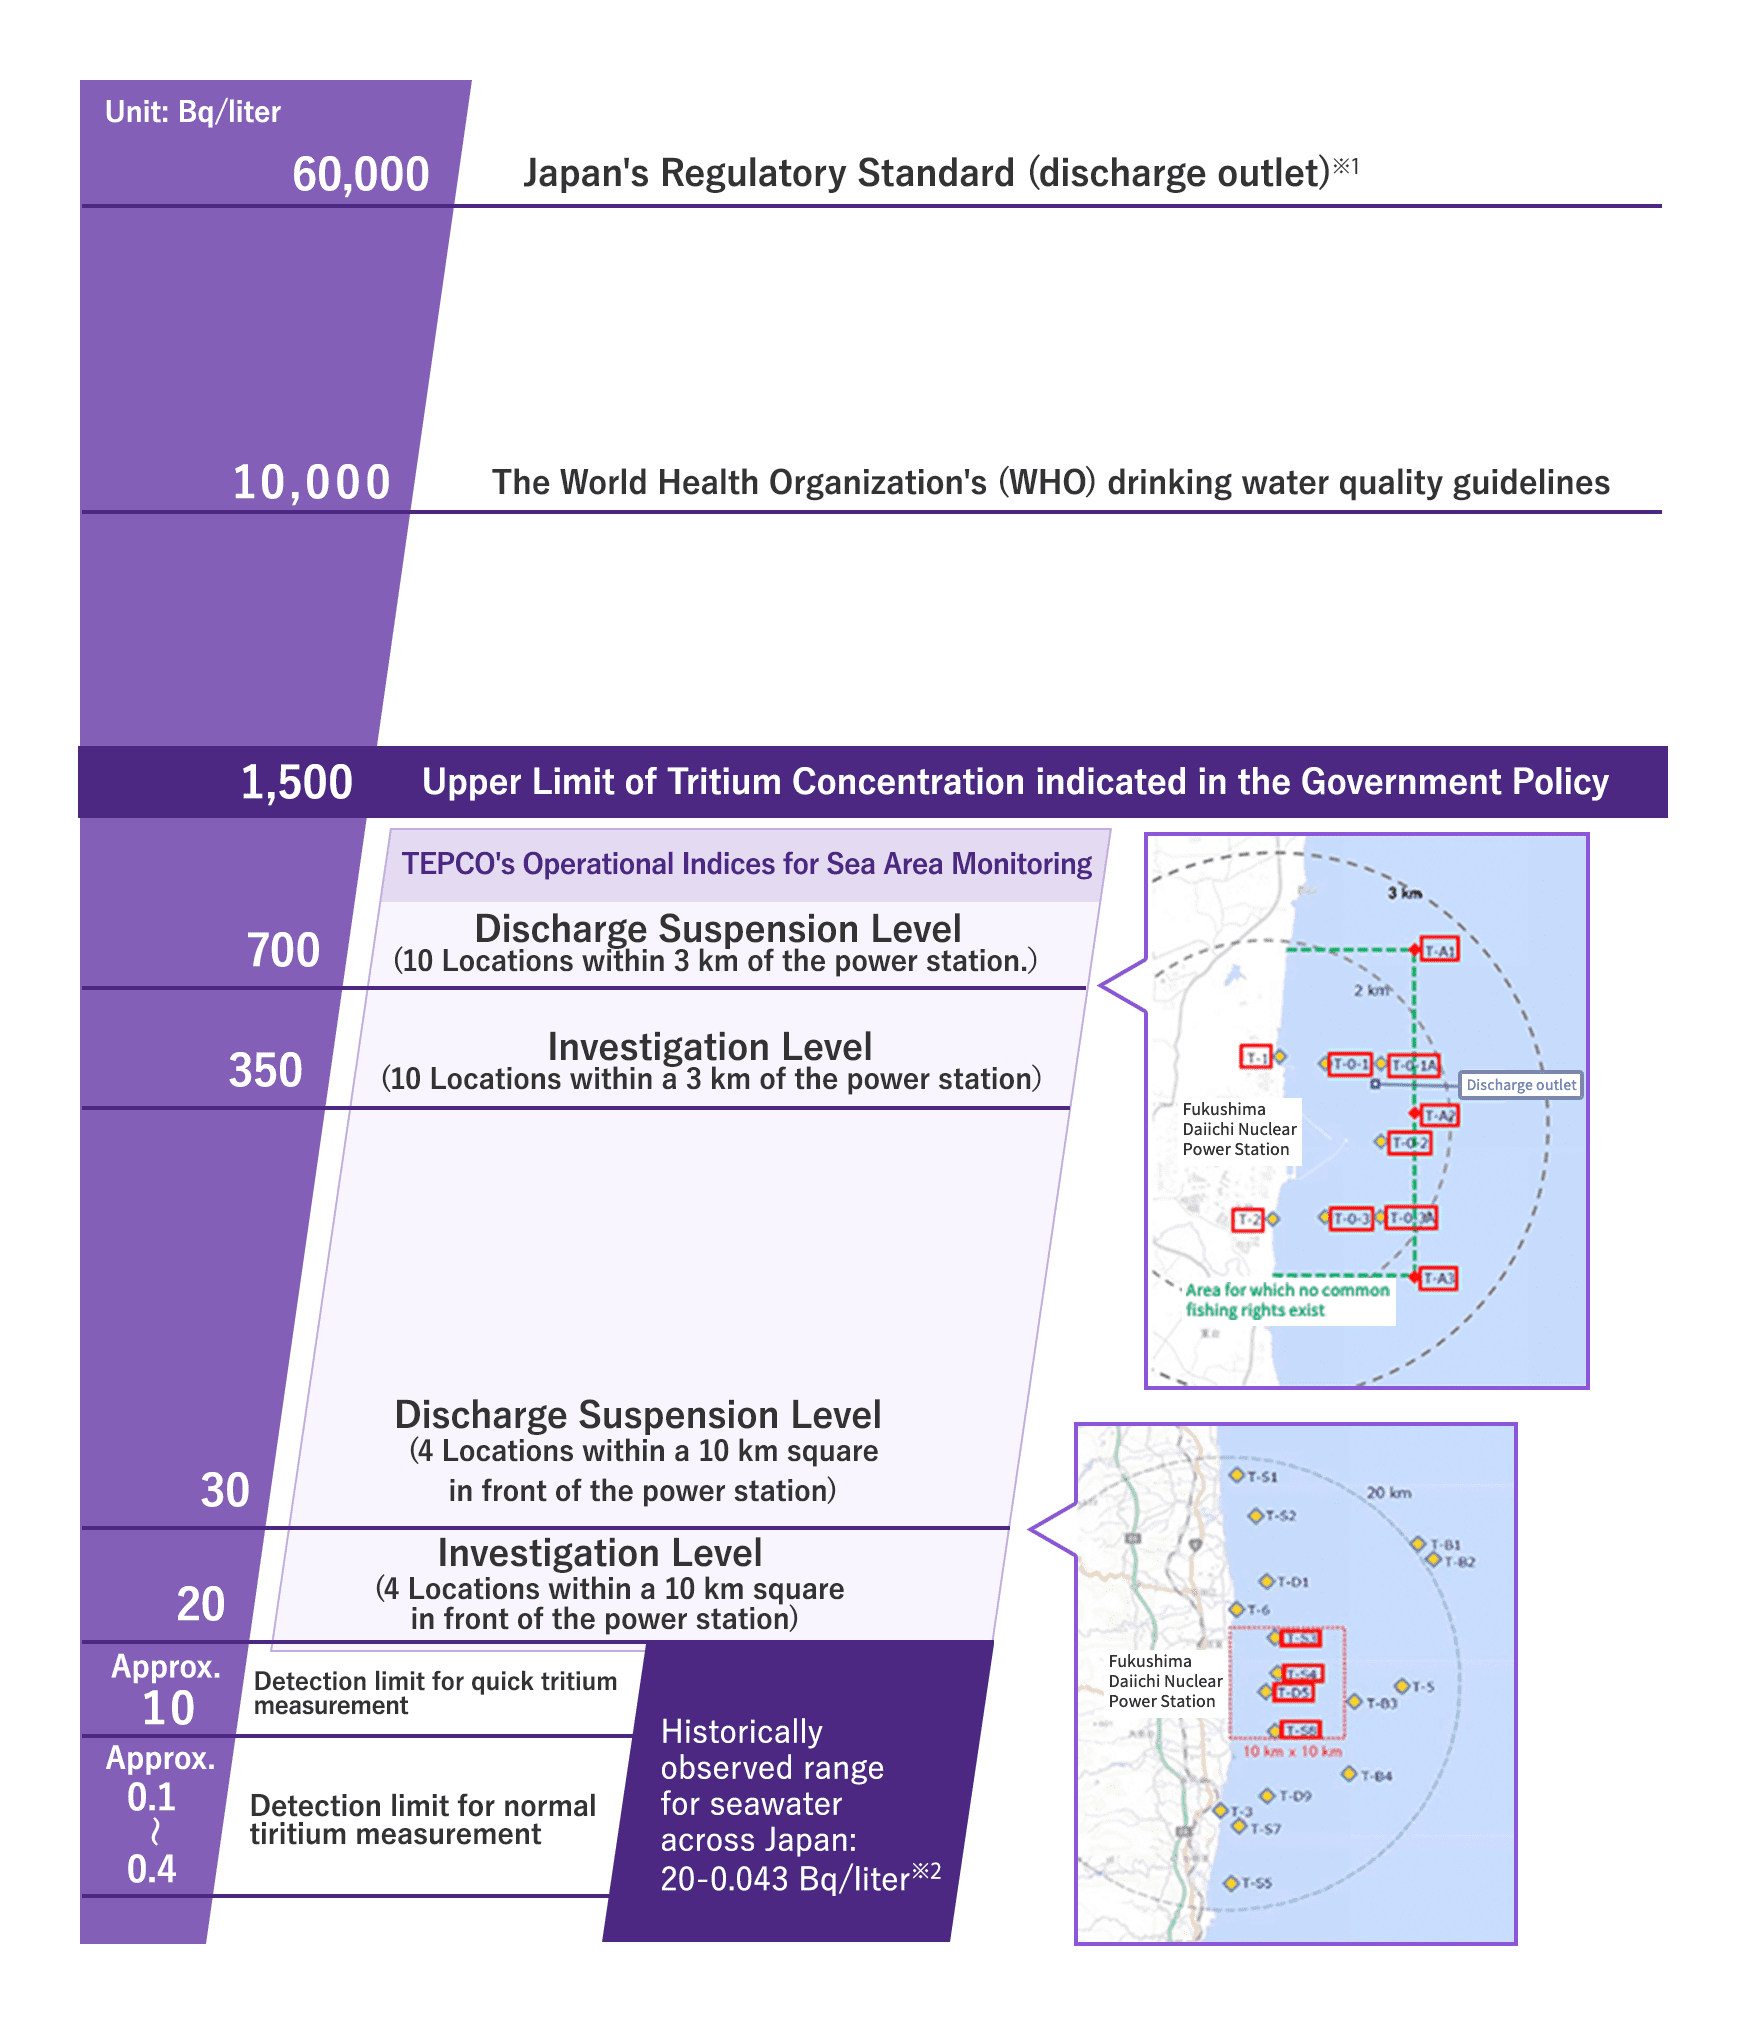
*1: This standard has been stipulated based on the calculation that if a person were to drink approximately 2 L of the water coming out of the discharge outlet of a nuclear facility every day for one year, his/her exposure would be 1 mSv.
*2: Source: Environmental Radioactivity and Radiation in Japan (Period: April 2019 to March 2022)
*3: Alternative location if safety cannot be ensured at T-2
FY 2026 Discharge History
(as of Jun. 20, 2026)
Annual accumulated ALPS treated water discharge volume
00,000 ㎥
Total accumulated ALPS treated water
discharge volume since the commencement
of discharge in August 24, 2023:
00,000,000
Annual accumulated tritium discharge volume
Approx. 0.0 TBq
There may be slight differences between planned and
actual values due to factors such as differences in
analysis results between the transfer source tanks and
the measurement/confirmation tanks.
Total accumulated tritium discharge volume
since the commencement of discharge
in August 24, 2023:
Approx. 00.0 TBq
Annual discharge limit of tritium:
22 TBq
Discharge history for each discharge
| Analysis results of ALPS treated water prior to dilution | ALPS treated water discharge history | ||||||
|---|---|---|---|---|---|---|---|
| Round | Analysis date at the measurement/ confirmation facility*1 |
Tritium concentration |
The sum of the ratios of the concentration of each radionucide to the regulatory concentration, excluding tritium |
Discharge period | Tritium concentrations after dilution*2 | Amount of ALPS treated water | Amount of tritium*3 |
| 1st | Mar. 31, 2026 | 24×104 Bq/liter |
0.31
<
Regulatory standards
1 |
Apr. 2, 2026 ~ Apr. 20, 2026 |
Max. 353 Bq/liter | 7,865 ㎥ | Approx. 1.9 TBq |
| 2nd | May. 28, 2026 | 17×104 Bq/liter |
0.45
<
Regulatory standards
1 |
Jun. 1, 2026 ~ Jun. 20, 2026 |
Max. 243 Bq/liter | 7,927 ㎥ | Approx. 1.3 TBq |
| 3rd | Jul. 2, 2026 | 17×104 Bq/liter |
0.48
<
Regulatory standards
1 |
- | - | - | - |
| 1st | Apr. 8, 2025 | 37×104 Bq/liter |
0.083
<
Regulatory standards
1 |
Apr. 10, 2025 ~ Apr. 28, 2025 |
Max. 489 Bq/liter | 7,853 ㎥ | Approx. 2.9 TBq |
| 2nd | Jul. 10, 2025 | 25×104 Bq/liter |
0.11
<
Regulatory standards
1 |
Jul. 14, 2025 ~ Aug. 3, 2025 |
Max. 351 Bq/liter | 7,873 ㎥ | Approx. 2.0 TBq |
| 3rd | Aug. 5, 2025 | 38×104 Bq/liter |
0.12
<
Regulatory standards
1 |
Aug. 7, 2025 ~ Aug. 25, 2025 |
Max. 500 Bq/liter | 7,908 ㎥ | Approx. 3.0 TBq |
| 4th | Sep. 9, 2025 | 21×104 Bq/liter |
0.12
<
Regulatory standards
1 |
Sep. 11, 2025 ~ Sep. 29, 2025 |
Max. 288 Bq/liter | 7,872 ㎥ | Approx. 1.7 TBq |
| 5th | Oct. 28, 2025 | 25×104 Bq/liter |
0.14
<
Regulatory standards
1 |
Oct. 30, 2025 ~ Nov. 17, 2025 |
Max. 339 Bq/liter | 7,838 ㎥ | Approx. 2.0 TBq |
| 6th | Dec. 2, 2025 | 31×104 Bq/liter |
0.19
<
Regulatory standards
1 |
Dec. 4, 2025 ~ Dec. 22, 2025 |
Max. 393 Bq/liter | 7,833 ㎥ | Approx. 2.4 TBq |
| 7th | Jan. 9, 2026 | 25×104 Bq/liter |
0.24
<
Regulatory standards
1 |
Mar. 6, 2026 ~ Mar. 24, 2026 |
Max. 363 Bq/liter | 7,834㎥ | Approx. 2.0 TBq |
| 1st | Apr. 17, 2024 | 19×104 Bq/liter |
0.31
<
Regulatory standards
1 |
Apr. 19, 2024 ~ May. 7, 2024 |
Max. 266 Bq/liter | 7,851㎥ | Approx. 1.5 T Bq |
| 2nd | May. 15, 2024 | 17×104 Bq/liter |
0.17
<
Regulatory standards
1 |
May. 17, 2024 ~ Jun. 4, 2024 |
Max. 234 Bq/liter | 7,892㎥ | Approx. 1.3 T Bq |
| 3rd | Jun. 26, 2024 | 17×104 Bq/liter |
0.18
<
Regulatory standards
1 |
Jun. 28, 2024 ~ Jul. 16, 2024 |
Max. 276 Bq/liter | 7,846㎥ | Approx. 1.3 T Bq |
| 4th | Aug. 5, 2024 | 20×104 Bq/liter |
0.12
<
Regulatory standards
1 |
Aug. 7, 2024 ~ Aug. 25, 2024 |
Max. 267 Bq/liter | 7,897㎥ | Approx. 1.6 T Bq |
| 5th | Sep. 24, 2024 | 28×104 Bq/liter |
0.078
<
Regulatory standards
1 |
Sep. 26, 2024 ~ Oct. 14, 2024 |
Max. 405 Bq/liter | 7,817㎥ | Approx. 2.2 T Bq |
| 6th | Oct. 15, 2024 | 31×104 Bq/liter |
0.083
<
Regulatory standards
1 |
Oct. 17, 2024 ~ Nov. 4, 2024 |
Max. 436 Bq/liter | 7,837㎥ | Approx. 2.4 T Bq |
| 7th | Mar. 6, 2025 | 31×104 Bq/liter |
0.076
<
Regulatory standards
1 |
Mar. 12, 2025 ~ Mar. 30, 2025 |
Max. 403 Bq/liter | 7,859㎥ | Approx. 2.4 T Bq |
| 1st | Jun. 22, 2023 |
14×104 Bq/liter |
0.28
<
Regulatory standards
1 |
Aug. 24, 2023 ~ Sep. 11, 2023 |
Max. 220 Bq/liter | 7,788㎥ | Approx. 1.1 T Bq |
| 2nd | Sep. 21, 2023 |
14×104 Bq/liter |
0.25
<
Regulatory standards
1 |
Oct. 5, 2023 ~ Oct. 23, 2023 |
Max. 189 Bq/liter | 7,810㎥ | Approx. 1.1 T Bq |
| 3rd | Oct. 19, 2023 |
13×104 Bq/liter |
0.25
<
Regulatory standards
1 |
Nov. 2, 2023 ~ Nov. 20, 2023 |
Max. 200 Bq/liter | 7,753㎥ | Approx. 1.0 T Bq |
| 4th | Feb. 26, 2024 |
17×104 Bq/liter |
0.34
<
Regulatory standards
1 |
Feb. 28, 2024 ~ Mar. 17, 2024 |
Max. 230 Bq/liter | 7,794㎥ | Approx. 1.3 T Bq |
| num | mm. dd 20yy |
n万 Bq/liter |
0.55
<
Regulatory standards
1 |
mm. 2, 2023 ~ mm. 2, 2023 |
Max. n Bq/liter | 0㎥ | Approx. 0 T Bq |
*1 Click on the date of analysis to see the pre-discharge analysis results of ALPS treated water in the Measurement /Confirmation tanks.
*2 During the discharge period, the tritium concentration in samples taken from seawater pipes is analyzed daily. Each result is given as "○○±△△Bq/L" taking into account the uncertainty (accuracy of the analysis data), and the value where "○○+△△Bq/L" reaches the maximum among the results during the period is given as "Maximum ▲▲Bq/L".
*3 There may be slight differences between planned and actual values due to factors such as differences in analysis results between the transfer source tanks and the measurement/confirmation tanks.
Discharge History
FY2026 Discharge Plan
(as of Mar. 26, 2026)
| Round | Discharge commencement period | Amount of ALPS treated water |
Tritium concentration*1 | Amount of tritium *3 |
|---|---|---|---|---|
| 1st | Apr. 2026 | Approx. 7,800 ㎥ | 15×104~25×104 Bq/liter*2 | Approx. 1.9 TBq |
| 2nd | May~Jun. 2026 | Approx. 7,800 ㎥ | 15×104 Bq/liter*2 | Approx. 1.2 TBq |
| 3rd | Jun.~Jul. 2026 | Approx. 7,800 ㎥ | 15×104~16×104 Bq/liter*2 | Approx. 1.2 TBq |
| 4th | Jul.~Aug. 2026 | Approx. 7,800 ㎥ | 16×104 Bq/liter*2 | Approx. 1.3 TBq |
| 5th | Aug.~Sep. 2026 | Approx. 7,800 ㎥ | 16×104~17×104 Bq/liter*2 | Approx. 1.3 TBq |
| 6th | Sep.~Oct. 2026 | Approx. 7,800 ㎥ | 15×104~19×104 Bq/liter*2 | Approx. 1.3 TBq |
| 7th | Oct.~Nov. 2026 | Approx. 7,800 ㎥ | 19×104 Bq/liter*2 | Approx. 1.5 TBq |
| 8th | Feb.~Mar. 2027 | Approx. 7,800 ㎥ | 19×104 Bq/liter*2 | Approx. 1.5 TBq |
*1 Tritium concentrations will be less than 1,500 Bq/liter by dilution more than 700 times with seawater
*2 Average value of the tank group that was assessed taking into account the radioactive decay until April 1, 2026
*3 There may be slight differences between planned and actual values due to factors such as differences in analysis results between the transfer source tanks and the measurement/confirmation tanks.